The OT Renaissance: A Change Agent’s Guide to Mastering the Digital Factory
Forward
The Lever and The Fulcrum
According to popular lore, Archimedes said, “Give me a lever long enough and a fulcrum on which to place it, and I shall move the world.”
In Operational Technology, that is exactly what we are trying to do. We are trying to move legacy infrastructure, entrenched behaviors, and decades of inherited ways of working that were never designed for the level of visibility and coordination modern operations now demand require.
For the last decade, most organizations have focused almost entirely on the lever: new platforms, new sensors, new integrations. The assumption has been that if the technology is powerful enough, transformation will follow.
But a lever without a fulcrum is just a piece of metal. It doesn’t move anything. People and process are the fulcrum. Without them, even the most advanced platform becomes another system that never quite delivers on its promise. When technology is placed on top of weak operational alignment, the result is not acceleration. It is friction.
This is not a technical manual. Instead, it’s a guide for the person responsible for making change happen in an environment that does not easily accept change. Whether you sit in the C-suite or on the plant floor, the challenge is the same. If you are tired of buying better tools and ready to make them work, this is where that shift begins.

Dean Stavrou
Head of Global Industrial Engineering
Introduction
At CoreX, we’ve seen the same pattern repeat itself across organizations. A transformation strategy is defined at the executive level. It is clear, well-intentioned, and often compelling. But as that strategy moves closer to the plant floor, something changes. The clarity fades. The urgency feels different. The people responsible for execution begin to see risk where leadership sees opportunity.
That gap is where most initiatives lose momentum. Not because the strategy is wrong, but because it was never translated into the realities of how work gets done.
This eBook focuses on Operational Technology Management (OTM) as a discipline. Not a one-time implementation, and not a bounded project, but an ongoing capability that shapes how operations function every day.
In practice, OTM behaves more like a system that is always running in the background. It determines whether production continues or stalls, whether safety risks are surfaced or hidden, and whether quality issues are caught early or discovered too late.
The lessons in this guide come from real environments. Some delivered immediate results. Others struggled before finding their footing. All of them revealed something important about how operational systems behave when they are placed under real pressure.
The goal is not to simplify the journey, but rather to make it navigable, even when it becomes complex. And to do that, we need to start by reframing how we think about the system itself.
Chapter 1
The Living Entity
In traditional IT environments, it is possible to build something, deploy it, and shift focus elsewhere. In operational environments, that model breaks down quickly. Production lines are reconfigured. Controllers are replaced. Firmware is updated. Dependencies change constantly.
In other words, what was accurate six months ago may no longer reflect reality today.
This is why OTM behaves less like a completed system and more like a living entity. It is continuously evolving, whether or not it is actively managed. When it is treated as a one-time implementation, the system begins to drift. Data becomes outdated. Relationships weaken. Blind spots begin to form.
This is how ghost data takes hold. Not through a single failure, but through a series of small gaps that accumulate over time.
Embracing Continuous Alignment
Discovery is not something that happens once. In ServiceNow, capabilities like Discovery, Service Graph Connectors, and data certification exist to maintain alignment between the system and the environment it represents. These are not deployment steps. They are ongoing mechanisms that keep the model current.
The CMDB only becomes valuable when it reflects the actual state of the floor. That requires continuous ingestion of data, regular validation, and a clear process for correcting what is no longer accurate.
At the same time, the OT Manager workspace should not be treated as a passive interface. It should function as a place where decisions are made and work is driven forward, connecting data to action in real time.
The Three Areas That Matter Most
The reason this level of alignment matters is simple. OTM directly impacts the outcomes that leadership already cares about.
Revenue is affected the moment production slows or stops.
Safety is embedded in the systems being managed.
Quality depends on process integrity.
The Constraint That Follows
Technology is rarely the limiting factor in these environments. The real challenge is getting people to trust and consistently use a system that changes how they work. If the platform does not reflect the realities of the plant floor, it will be bypassed, regardless of how well it was implemented.
Once that happens, the system begins to lose relevance. And even when the data model is sound, there is another layer to address. Because if the system is going to stay aligned with reality, the data underneath it has to be treated with the same level of discipline.
Chapter 2
Data Governance
If Chapter 1 establishes that the system is always changing, then Chapter 2 raises the next question: What ensures that the foundation keeps up? In OTM, the answer is data.
Organizations often move quickly into workflow automation, implementing Incident, Change, or Vulnerability Response processes to show progress. On the surface, this looks like momentum. In practice, it can create a fragile system if the underlying data is incomplete or untrusted.
Automation depends on context. Without it, even well-designed work flows introduce risk. If an asset is misclassified, routed incorrectly, or missing key relationships, the system cannot make informed decisions. Tickets are assigned to the wrong teams. Changes are approved without a full understanding of the impact. Vulnerabilities are prioritized based on incomplete information.
Within ServiceNow, this often appears as a CMDB that is populated but not relied upon. Records exist, but relationships are shallow. Discovery identifies devices, but no process exists to confirm their relevance or accuracy over time. That gap between discovered data and trusted data is where systems begin to fail.
It is also the line that separates organizations that can take advantage of AI from those that cannot. As platforms like ServiceNow introduce capabilities around AI agents, autonomous workflows, and predictive operations, the expectation shifts. The system is no longer just recording what has happened. It is expected to interpret, recommend, and in some cases, act.
None of that is possible without a trusted data foundation. AI does not fix bad data. It depends on it being right. Organizations that invest early in data governance are not just improving their current operations. They are preparing their environments to support a new class of capabilities that require accuracy, context, and consistency at scale.
The "Day 2" Problem:
Sustaining the Digital Twin
Most implementations look successful at go-live. The real test happens after. Without an operating model, data begins to drift. Assets change. Ownership changes. Context is lost. Over time, the system stops reflecting reality.
ServiceNow provides tools like health dashboards and data certification to manage this, but tools alone are not enough. There has to be accountability for maintaining the system.
The New Industrial Operating Model
To stabilize the foundation, ServiceNow customers must formalize three technical personas. Without these roles, your data rots. And when the data rots, the home falls.
The Platform Owner (The system architect and technologist who keeps the lights on.)
The Process Owner (The strategist who defines how we work.)
The Data Steward (The OT subject matter expert and engineer on the floor who validates that the machine is actually there.)
Engineering the Rock Foundation
Once the data foundation is stable, the system becomes capable of supporting automation, analytics, and decision-making in a meaningful way.
But even with strong data, there is another challenge that emerges. Because a system that is accurate but difficult to use will still fail to gain adoption.
Chapter 3
The Frictionless Operation
Even the most well-structured system will struggle if it creates friction for the people expected to use it. In most operational environments, the primary competitor is not another enterprise platform. (Let’s not belabor this. It’s Excel.) Make no mistake, Excel remains widely used because it is immediate, flexible, and requires very little effort to get started. It allows users to capture and manipulate data without interruption, which makes it highly effective for day-to-day work. Replacing that behavior requires more than introducing a new system. It requires offering an experience that feels just as efficient.
Understanding Friction
Every additional step in a workflow introduces cost to the user. If entering or updating information takes longer in the system than it does in a spreadsheet, users will find ways to work outside the system. This is not resistance. It is a practical response to inefficiency.
Over time, these workarounds become entrenched. Shadow systems form. Data becomes fragmented. The central platform begins to lose relevance.
Designing for Adoption
ServiceNow provides several capabilities that, when implemented effectively, can reduce friction.
Mobile capabilities enable users to interact with assets directly from the floor, reducing the distance between the system and the work being performed.
Guided workflows simplify complex processes, allowing users to complete tasks without needing to understand the underlying data structures.
When combined with well-designed workspaces, these capabilities can create an experience that feels faster and more intuitive than traditional alternatives.
The Shift to Action
When the system becomes easier to use than the workaround, adoption begins to happen naturally. At that point, the CMDB transitions from being a static record to a system that reflects real activity. Data remains accurate because users see value in maintaining it.
But even with strong adoption, there is one more barrier that can limit progress. And it does not exist in the system itself.
Chapter 4
The Human Element
The most consistent point of resistance in any transformation effort sits in the middle of the organization.
For example, plant managers and site leaders are responsible for maintaining output. Their success is measured in uptime, throughput, and efficiency. Any change that introduces risk to those outcomes is viewed carefully.
When new systems are introduced, the concern is practical. Additional steps can slow down response times. Increased visibility can change how performance is evaluated. External oversight can feel like a loss of control. These reactions are normal. And they can tell a bigger story.
Building Alignment
Progress begins by aligning with the priorities that matter locally. Instead of focusing on frameworks or models, the conversation needs to center on outcomes. Reduced downtime. Faster repairs. Improved visibility into critical assets.
When the system can demonstrate value in those areas, it begins to build trust.
One of the most effective ways to drive adoption is to solve a specific, visible problem. Improving spare parts visibility, streamlining contractor onboarding, or reducing time to repair can create an immediate impact. These wins demonstrate that the system is not just adding structure but improving performance.
Once that value is established, it becomes easier to introduce broader standards and governance
What Happens Next
As trust builds, adoption spreads beyond individual sites. At that point, the focus shifts again, from gaining acceptance to delivering measurable value at scale.
Chapter 5
Value Realization
“Don’t boil the ocean” is a term that gets tossed around a lot, but it’s popular because it is solid advice. The single most dangerous phrase in OTM is, “We go live in 12 months.”
Why? A year from now, the budget might get cut. The sponsor of the project could leave, and the technology will have certainly evolved. Instead of pointing to a far-off timeline, start delivering value in milestones.
It’s important to acknowledge there’s a danger of creating ServiceNow fatigue in projects with high licensing costs but no go-live visibility for an entire year. That long lead time creates a technical debt mountain by the time of launch, 12 months out, and the Now Platform has undergone major upgrades, rendering custom code legacy.
Instead of announcing the one-year launch, shift the ServiceNow implementation goal from a date to a “pulse” with delivery of production-ready features every 30 days, keeping stakeholders invested.
The Ongoing Rollout:
Sprints for the Shop Floor
Taking a continuous improvement approach to the rollout allows for providing an improved value from the beginning of the implementation.
Month 1: The "Visibility" Sprint (Crawl)
- Objective: 100% visibility of Level 3/4 Network Devices at a single Pilot Site.
- Technical Lever: Deploying OT Discovery or Service Graph Connectors (e.g., Claroty, Dragos, or Microsoft Defender for IoT).
- The Win: A verified, CSDM-compliant CMDB for one production cell. No more "ghost assets."
Month 2: The "Context" Sprint (Walk)
-
Objective: Automate Vulnerability Grouping and Risk Scoring.
- Technical Lever: Implementing OT Vulnerability Response (OTVR). Using Assignment Rules to route vulnerabilities to the specific Site Data Steward automatically.
- The Win: Moving from "We have 10,000 vulnerabilities" to "We have 50 critical patches needed on Line 4."
Month 3: The "Scale" Sprint (Run)
-
Objective: Regional expansion and Service Mapping.
-
Technical Lever: Using Configuration Templates and Cloning to replicate the pilot site’s success across the region.
-
The Win: Global visibility with local accountability.
The Value Scorecard
Instead of reporting performance analytics like tasks completed, start reporting on value realized with a scorecard that tracks several key metric areas:
Risk Avoidance
This is the security metric and involves tracking the remediation Target Compliance percentage, and explaining that compliance wasn’t just “patching servers,” it was mitigating 50 exploits on production-critical PLCs that govern the cooling system.
Operational Efficiency
This is the velocity metric and involves measuring MTTR through the OT Manager Workspace. The proof comes in results like automated ticket routing, which reduced the “identification-to-assignment” gap from four hours to four seconds.
Financial Stewardship
This is the bottom-line impact where leveraging Hardware Asset Management (HAM) identifies under-utilized or missing assets, such as finding $200k in “ghost assets,” devices currently on maintenance contracts that no longer exist on the floor.
While rolling out an implementation over time with ongoing wins and proving value, create an Update Set or Scoped App that continues learning, meaning expansion to site number 10 is significantly faster than site one.
Why use the measured rollout with the incremental wins approach? The result is a platform that evolves with the business, delivering small, compounding wins that make the project too big and too useful to fail.
Chapter 6
Choosing Your Strategic Compass
We hate using cliches, but there is no "one size fits all" strategy for a ServiceNow deployment. You must choose the strategy that fits your current maturity. Neither is wrong. But choosing the wrong one for your culture can be fatal.
Success is about Common Service Data Model (CSDM) readiness and linking strategy with maturity. A broad strategy on a slower maturity level leads to CMDB bloat and failed adoption. It’s also about understanding cultural guardrails, such as whether your organization prioritizes regulatory shielding (read: compliance) or operational resilience (read: visibility).
If you think in terms of strategy and positioning, somewhat like chess, there are two ways to approach this:
Strategy A:
The Targeted Move (Focused and Fast)
The technical play is deploying a “tactical edge” solution focused on IRM (Integrated Risk Management) or specific policy and compliance modules to hit single audit targets. The core architecture includes a baseline CMDB populated with the CIs required for specific mandates, such as Critical Cyber Assets for NERC CIP.
With this approach, the GRC/IRM portal is leveraged for evidence collection before automating Discovery and is best suited for addressing a “burning platform” and meeting upcoming NERC CIP audits, NIST 800-53 requirements, or TSA Pipeline Security mandates.
The pros of this maneuver are rapid Authority Document mapping and audit readiness. The cons are that it creates "data islands." Without Service Graph Connectors or Discovery, you're building a static record that will eventually drift from technical reality
Strategy B:
The Positional Build (Broad and Deep)
The technical play is a full-stack ITOM plus SecOps plus CSDM rollout. This is a "foundation first" approach, moving through the CSDM "crawl-walk-run" phases site-by-site.
The core architecture includes an automated foundation by deploying ServiceNow Discovery and Service Graph Connectors, such as Claroty, Dragos, or Nozomi for OT, from day one. Service mapping builds the relationship between the hardware (CI) and the Business Service/App Service.
This approach is suited for organizations with a centralized Platform Governance Board and complex environments with high-volume OT sites where manual data entry is a mathematical impossibility.
The pros of this strategy are operational health and real-time visibility into the state of the organization. There’s also high automation potential for Vulnerability Response (VR) and Incident Management. The cons are friction in the form of a high "tax" on local site leads. Slower time-to-value for the Compliance team while the CMDB is being scrubbed and populated.
Avoiding the Misalignment Challenge
There are two pitfalls to watch for when choosing the strategic approach to deployment. There’s an audit trap with "army advance" when an audit is three months away. The danger is failing the audit while waiting for Discovery to be perfect.
There’s a silo trap when using a targeted move indefinitely. The danger is ending up with ten different spreadsheets in ServiceNow that don’t intercommunicate, doubling technical debt.
Diagnostic: Which Path Are You On?
| Metric | Strategy A (Targeted) | Strategy B (Positional) |
| Primary Driver | Regulatory Deadline | Long-term Digital Transformation |
| Data Source | Flat-file imports / Manual entry | Automated Discovery / Connectors |
| CSDM Phase | Crawl (Foundation) | Walk/Run (Service- Centric) |
| Stakeholder |
Chief Compliance Officer |
VP of Operations / CISO |
Chapter 7
The Journey Map
The CSDM & ISA-95 Blueprint
- Technical Lever: Implementing CSDM 4.0/5.0 as the data backbone.
- The Goal: Mapping OT assets into the ISA-95 Equipment Model within ServiceNow. This ensures every PLC or HMI is contextually tied to a Production Line, Plant, and Business Service.
- The "Why": Without this, you have a list of IPs; with this, you have a Service Map.
Turning on the Lights (OT Discovery)
- Technical Lever: Deploying OT Discovery and Service Graph Connectors (e.g., Claroty, Dragos, Microsoft Defender for IoT).
- The Goal: Configuring MID Server clusters across segmented factory networks to ingest high-fidelity data without impacting industrial protocols.
- The Win: Moving from unknown devices to a real-time digital twin.
Locking the Doors (OTVR)
- Technical Lever: Overlaying OT Vulnerability Response.
- The Goal: Using Vulnerability Calculators to prioritize patching based on the criticality of the production line, such as a vulnerability on a pacemaker assembly line scores higher than one on a packaging line.
- The Win: A prioritized remediation list.
Managing the Work (Service Ops)
- Technical Lever: Incident and Change Management tailored for the plant floor.
- The Goal: Integrating Maintenance Windows with Change Schedules to ensure IT patches don't accidentally stop a 24/7 production run.
- The Win: Standardized, governed workflows that replace "verbal approvals."
The Lifecycle (OTAM)
- Technical Lever: Hardware Asset Management (HAM) for OT.
- The Goal: Tracking Asset Lifecycle States (End-of-Life, End-of-Support) and calculating the "Cost of Obsolescence."
- The Win: Financial predictability and proactive hardware replacement strategies.
A System of Action (AI and Autonomous Operations)
- Technical Lever: ServiceNow AI capabilities, including predictive intelligence,AI agents, and emerging frameworks like AI Control Tower and AutonomousWorkforce.
- The Goal: Enabling the platform to move beyond tracking and coordination into interpretation and action.
- The Reality: AI in OT environments starts with data that is complete, contextual, and continuously maintained.
- The Win: Moving from reactive operations to informed, anticipatory ones. The platform begins to feel less like a system that records work and more like one that actively supports it.
As AI capabilities continue to evolve within platforms like ServiceNow, organizations that have invested in their data foundation will be able to take advantage of them immediately. Those who have not will find that the same gaps that limited automation now limit intelligence.
The Psychological Hype Cycle
Every implementation reaches a point where progress feels uncertain. Initial enthusiasm gives way to a clearer understanding of the challenges involved. Data inconsistencies become visible. Adoption slows. Questions begin to surface.
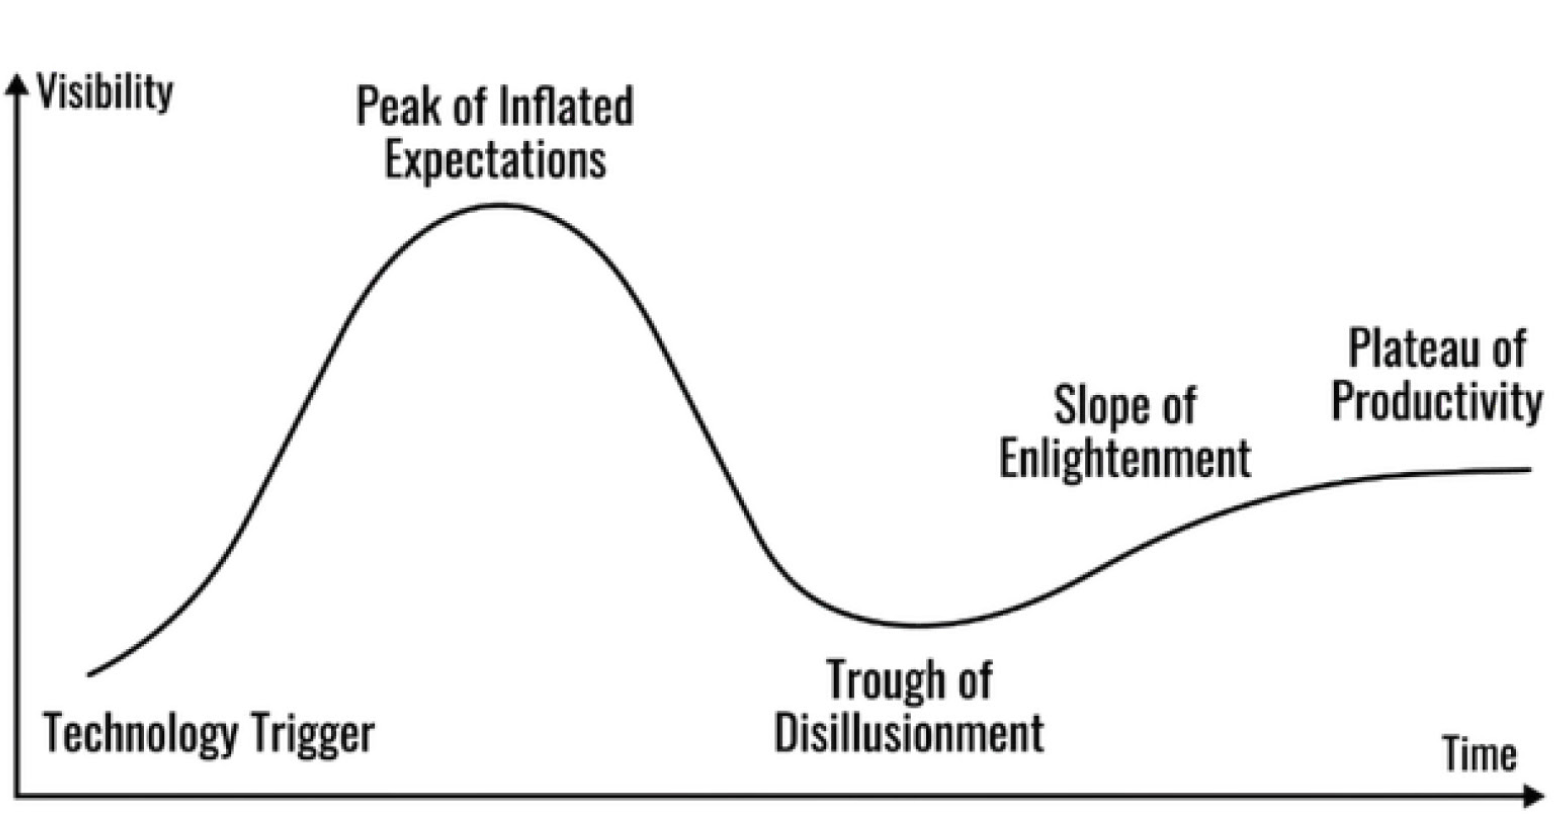
To provide more detail, at kickoff, there’s uninformed optimism with stakeholders excited about a “gold standard" vision.
During the data reveal, there’s informed pessimism, such as when the first Discovery scan returns 40% "unclassified" devices and conflicting legacy spreadsheets.
And finally, there’s a valley during the peak friction 4-6-month stretch. The implementation becomes difficult, the data seems like it’s messy, and plant managers are threatening to go back to their Excel spreadsheets. This is where 70% of projects fail.
Surviving the Valley
Tactically, keep 3-5 low-complexity, high-visibility features in the backlog to be deployed only when morale drops. An example is rolling out Mobile QR scanning by enabling a tech to scan an asset on their phone and instantly see the manual and last maintenance date. It feels like magic and validates the system's utility instantly.
Another win is automating attestation. Instead of asking for a full audit, use ServiceNow Data Certification to send one-click, "Is this still here?" tasks to the floor. It reduces the "input tax" and improves data quality during the slump.
Finally, move the focus from tasks to impact. Stop reporting on CIs Created. Start reporting on Risk Reduction. For example, a scorecard should read, "In the last 30 days, we successfully identified 12 critical exploits on line four that were previously invisible."
Getting Past the Valley
As those improvements accumulate, confidence returns. The system becomes more reliable. Workflows become more consistent. The previous way of working begins to feel less efficient by comparison.
At that point, the platform shifts from being a project to being part of how the organization operates.
Chapter 8
The Actionable Playbook
As change agents, we often speak the language of engineering. We talk about reliability, uptime, and latency. Your CFO does not care. Your CFO cares about Risk-Adjusted Capital Avoidance.
Instead, you need to learn to calculate the Cost of Inaction (COI): The formula is Average Hourly Revenue of Line X * Estimated Downtime Hours = The Check.
For example, if a line generates $50k/hour, and you prevent a 4-hour outage, you just saved $200k. When you frame OTM as an insurance policy for revenue, the budget always gets approved.
As AI capabilities continue to evolve within platforms like ServiceNow, organizations that have invested in their data foundation will be able to take advantage of them immediately. Those who have not will find that the same gaps that limited automation now limit intelligence.
Speaking Finance:
The CFO Translation
To secure long-term funding, ServiceNow leads must move beyond "IT Metrics" (SLA compliance) and embrace "business metrics" via revenue protection.
The CFO isn’t worried about the ServiceNow instance having a clean CMDB. That C-suite role cares about avoiding the capital expenditure required to replace a $2M machine that failed because a $50 firmware patch wasn't tracked.
Thinking about COI, the argument for CFO is, "If we don't implement OT Vulnerability Response, we are gambling $200k in revenue per four-hour outage on Line 4." Using levers like Performance Analytics (PA) turns ServiceNow into a revenue insurance policy by actions like creating a "Business Value Dashboard" that maps Incident Priority to Financial Impact. This provides the CFO with a real-time view of potential loss prevented by resolving critical OT incidents before they hit the production ceiling.
The Monday Morning Checklist:
Tactical Momentum
Some steps turn ideas into tactics and strategy into technical actions. Here’s a four-point plan
Find the weak link
through mining and optimization using the Process Mining module (or simple audit trail analysis) to find the one manual workflow (like "Spare Part Requests" or "Manual Safety Audits") that is currently managed in a shadow spreadsheet. Automating that single process using Flow Designer saves the plant floor immediate, measurable hours.
End a report
through platform hygiene and conducting audits with dashboards and scheduled reports. Identify reports that are being sent but never clicked. And reducing noise by deleting low-value reports increases the signal of high-value metrics, making the platform feel more like a surgical tool and less like a filing cabinet.
The Lunch Test
through UX/UI simplicity by reviewing Service Portal or Mobile Agent screens. If a shift supervisor cannot report a machine breakdown in the time it takes to eat a sandwich, the form has too many mandatory fields. The goal is zero training with UI policies to hide everything except the mission-critical data points for the operator.
Visit a Leader
by attending a listening tour. This entails visiting the most resistant plant manager. Don't bring a laptop for a demo; bring a notepad instead. Where this listening tour leads is actionable ideas like finding one localized problem, such as "I can never tell when a contractor is on-site," and building a Low-Code App Engine solution for that specific issue.
The Change Agent’s North Star
The result of this shift in approach is moving from a System of Record (keeping a list of assets) to a System of Action (driving production efficiency). The tangible outcome is a ServiceNow instance that is woven into the fabric of the factory floor, seen as a core to operations rather than a corporate mandate.
Chapter 9
The Movable Object
We know transformation isn’t easy. If it were, everyone would have a fully autonomous digital factory. But let’s call back to the idea of the lever and the fulcrum from the opening of the book.
-
You have the Technology (The Lever).
-
You are building the People and Process (The Fulcrum).
-
Any object is movable if the right amount of effort is placed at the right point.
-
You are the Change Agent. You are the one who applies the force.
All that’s left is for you to move the world.
Unlock Value from Your ServiceNow Investment
Discover how CoreX can help optimize your business operations, drive efficiency, and maximize the power of ServiceNow. Connect with us today to explore the possibilities.